UCL dissertation · 2025–26
Build-Break-Balance
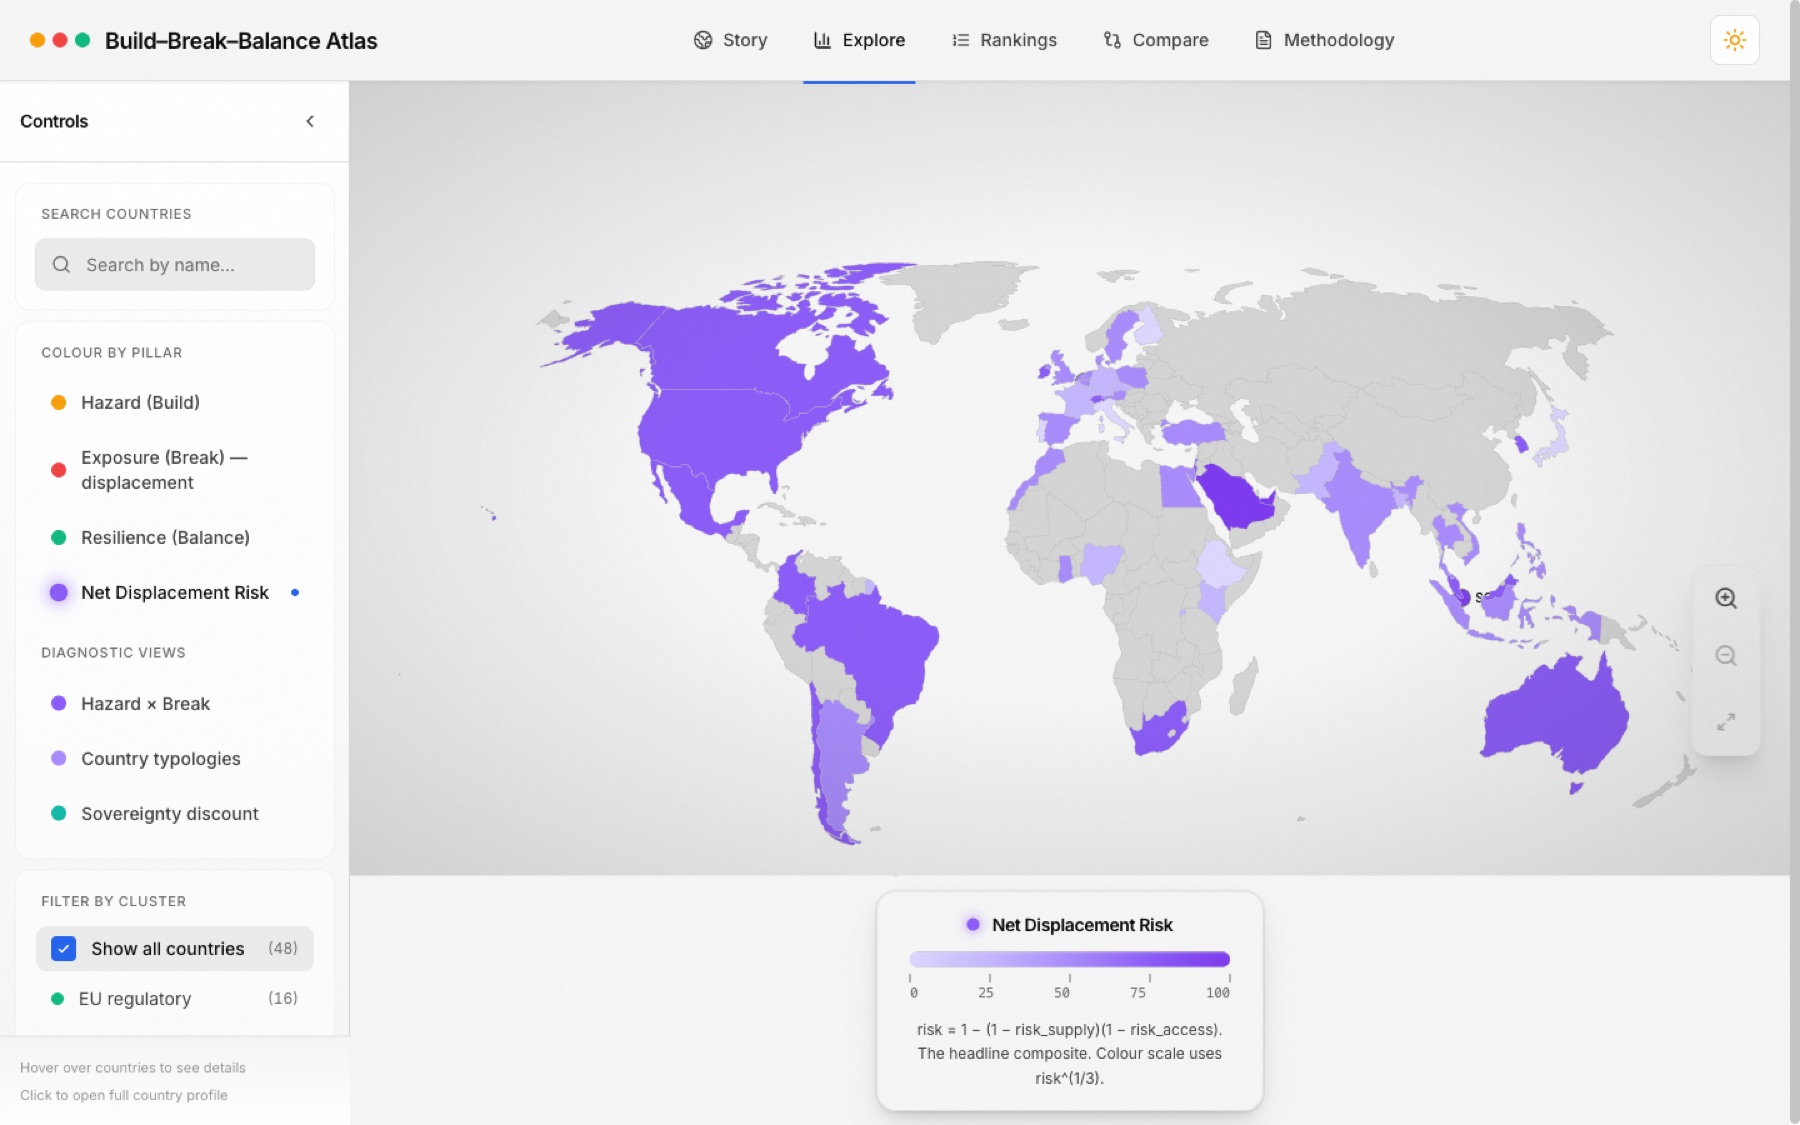
AI readiness rankings add everything into one score, so a country with lots of AI and weak rules can still come out on top. I built a measure that keeps those apart and published the results as an interactive atlas.
- 48countries plus the EU, across every income group
- 92national AI and data-protection policies read and scored
- 12 of 235scores I couldn’t verify, published with a flag
- 1,000,000simulations to test which rankings hold up
The question
The big AI readiness rankings (Oxford Insights, WIPO, the Network Readiness Index) add a country’s AI capability and its governance into one score. A country can be building AI much faster than it can regulate it and still rank near the top, because the strong number hides the weak one.
Those rankings tell you who is best placed to benefit from AI. I wanted to know where it could cause the most damage that nobody is equipped to deal with.
What I built
I split the problem into three parts and kept them separate, so a high score on one can’t cancel out a low score on another.
- Build is where AI capacity physically sits: cloud regions, data centres, power and connectivity.
- Break is how exposed jobs are to AI. I adjusted it for age, because the same exposure means lost jobs in a young, growing workforce and filled gaps in an ageing one.
- Balance is whether AI rules are actually enforced, not just whether a strategy has been published.
To score Balance I read 92 policy documents. A language model pulled out the relevant passages, I scored them separately, and every quote had to match the original document word for word. The other data came from the World Bank, the ILO and maps of cloud regions and data centres.
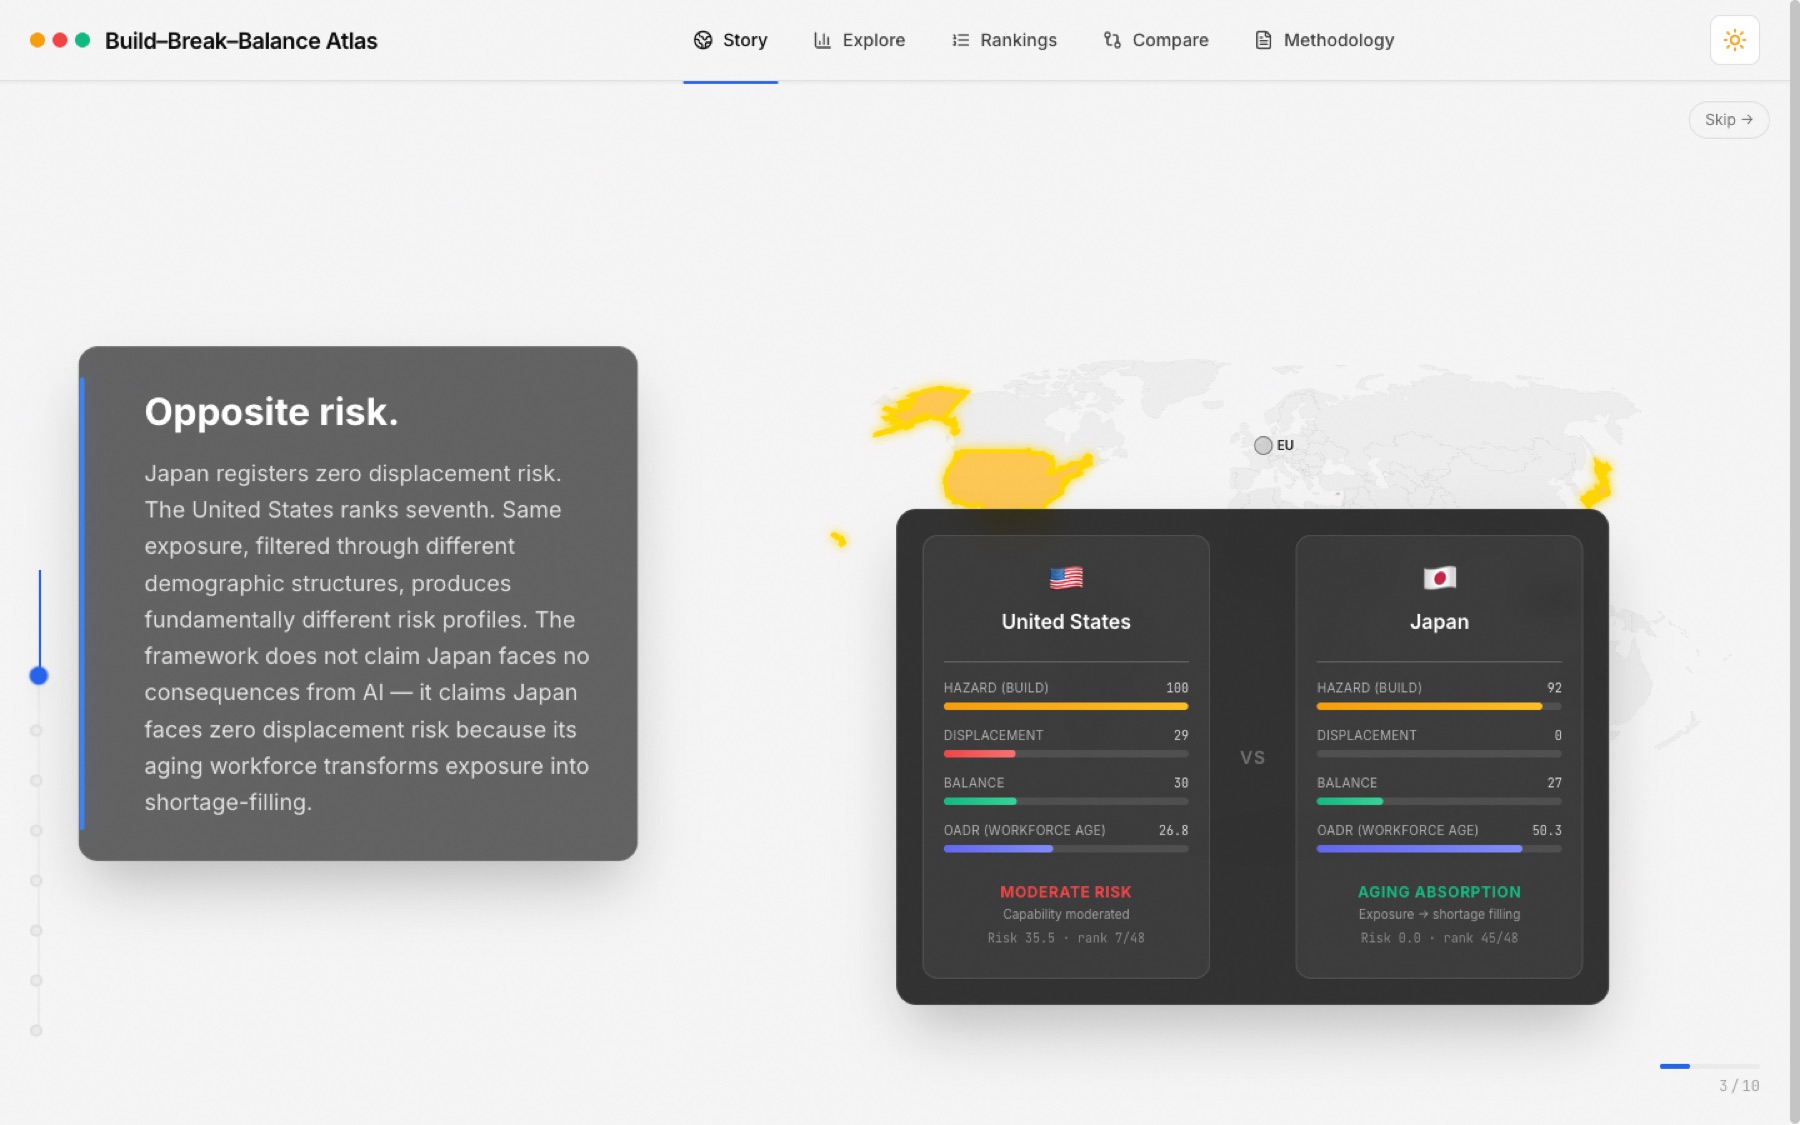
What I found
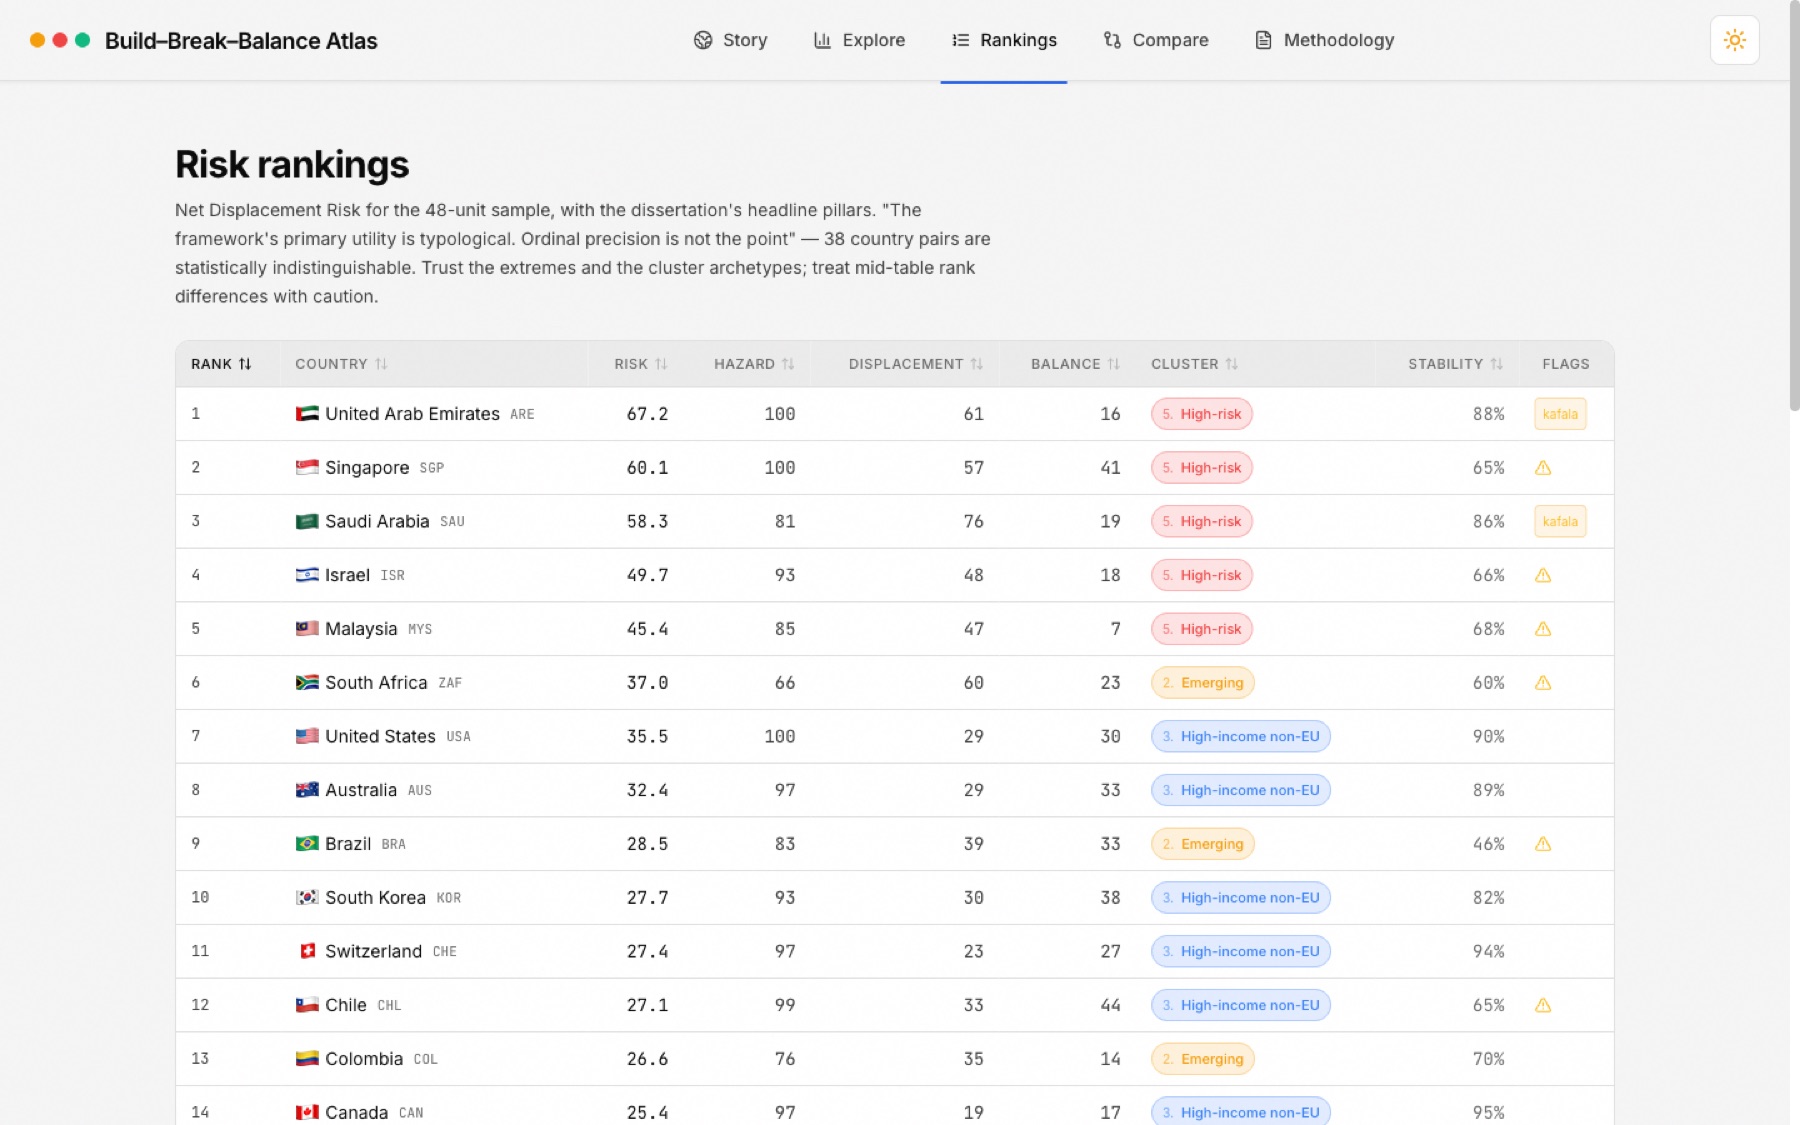
The highest risk is where a lot of AI capacity and a young, exposed workforce meet weak enforcement. The UAE, Singapore, Saudi Arabia, Israel and Malaysia come top. The big readiness rankings put the same five among the most AI-ready countries in the world.
Singapore is the clearest example. It scores 3 out of 3 on auditing and enforcement and 0 out of 3 on protecting workers. A single governance score would call it average. Across the sample, 14 of 47 countries score zero on protecting workers.
Clustering the countries gave five clear types, and they mostly line up with geography. They held up when I resampled the data. The European group stayed together 96% of the time.
How much to trust it
I tested nine other ways of building the measure. In eight of them the rankings barely moved. The one that changed them was dropping the age adjustment, which tells you that adjustment matters.
The middle of the table is crowded. 38 pairs of countries can’t really be told apart; Australia (8th) and the Philippines (17th) are a coin flip. So the atlas says to trust the top, the bottom and the five types, and not to read much into small differences in the middle.
What I’d do next
Repeat it each year as the EU AI Act starts being enforced, look at regions inside big federal countries, and check the displacement scores against what actually happens to jobs.